Performance: views, completion and drop-off
How many people open, start and finish your form, how long it takes, and where they leave.
Every plan
On this page
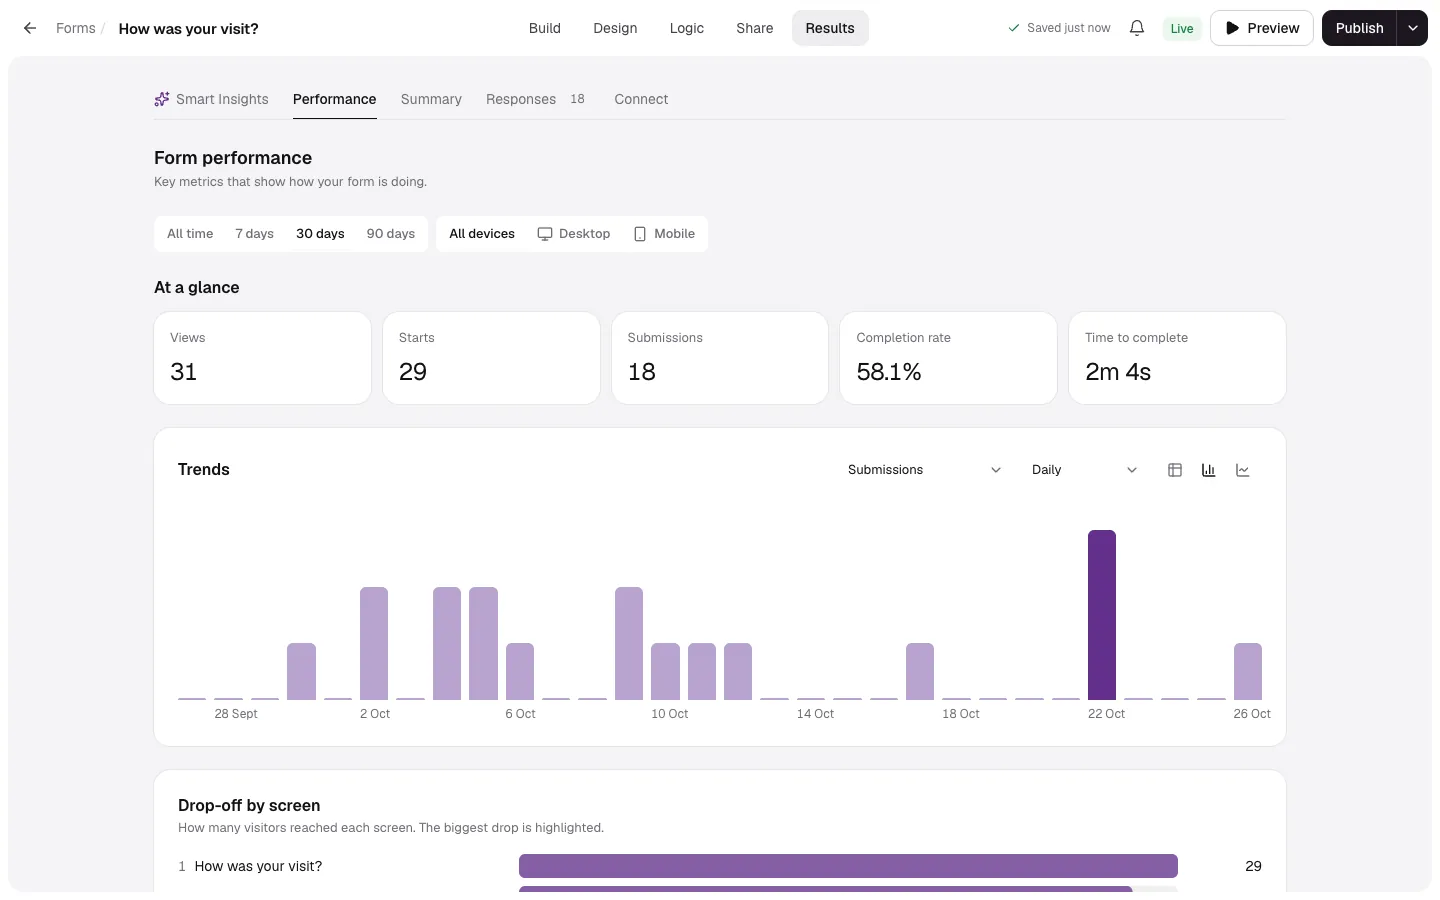
At a glance
| Tile | Meaning |
|---|---|
| Views | People who opened the form. |
| Starts | People who answered at least one question. |
| Submissions | Completed responses (not spam or tests). |
| Completion rate | Submissions ÷ views. |
| Time to complete | Average, from start to submit. |
Choose a Period (All time, 7, 30 or 90 days) and a Device (All devices, desktop or mobile).
Trends
Pick a Metric (submissions, views, starts or completion rate), Group by daily, weekly or monthly, and show it as a Bar chart, Line chart or Table.
Drop-off by screen
How many visitors reached each screen, with the biggest drop highlighted. A big drop usually points at a question that's confusing, too personal or too long.
Views are counted with an anonymous visitor id kept in the respondent's browser; no IP addresses and no tracking cookies.